How to Debug Flows and View Execution Logs in Chatbot Studio?
In this guide, you’ll learn how to debug your chatbot flows and access detailed execution logs to understand how your flow is working in real-time.
Accessing Flow Execution Logs:
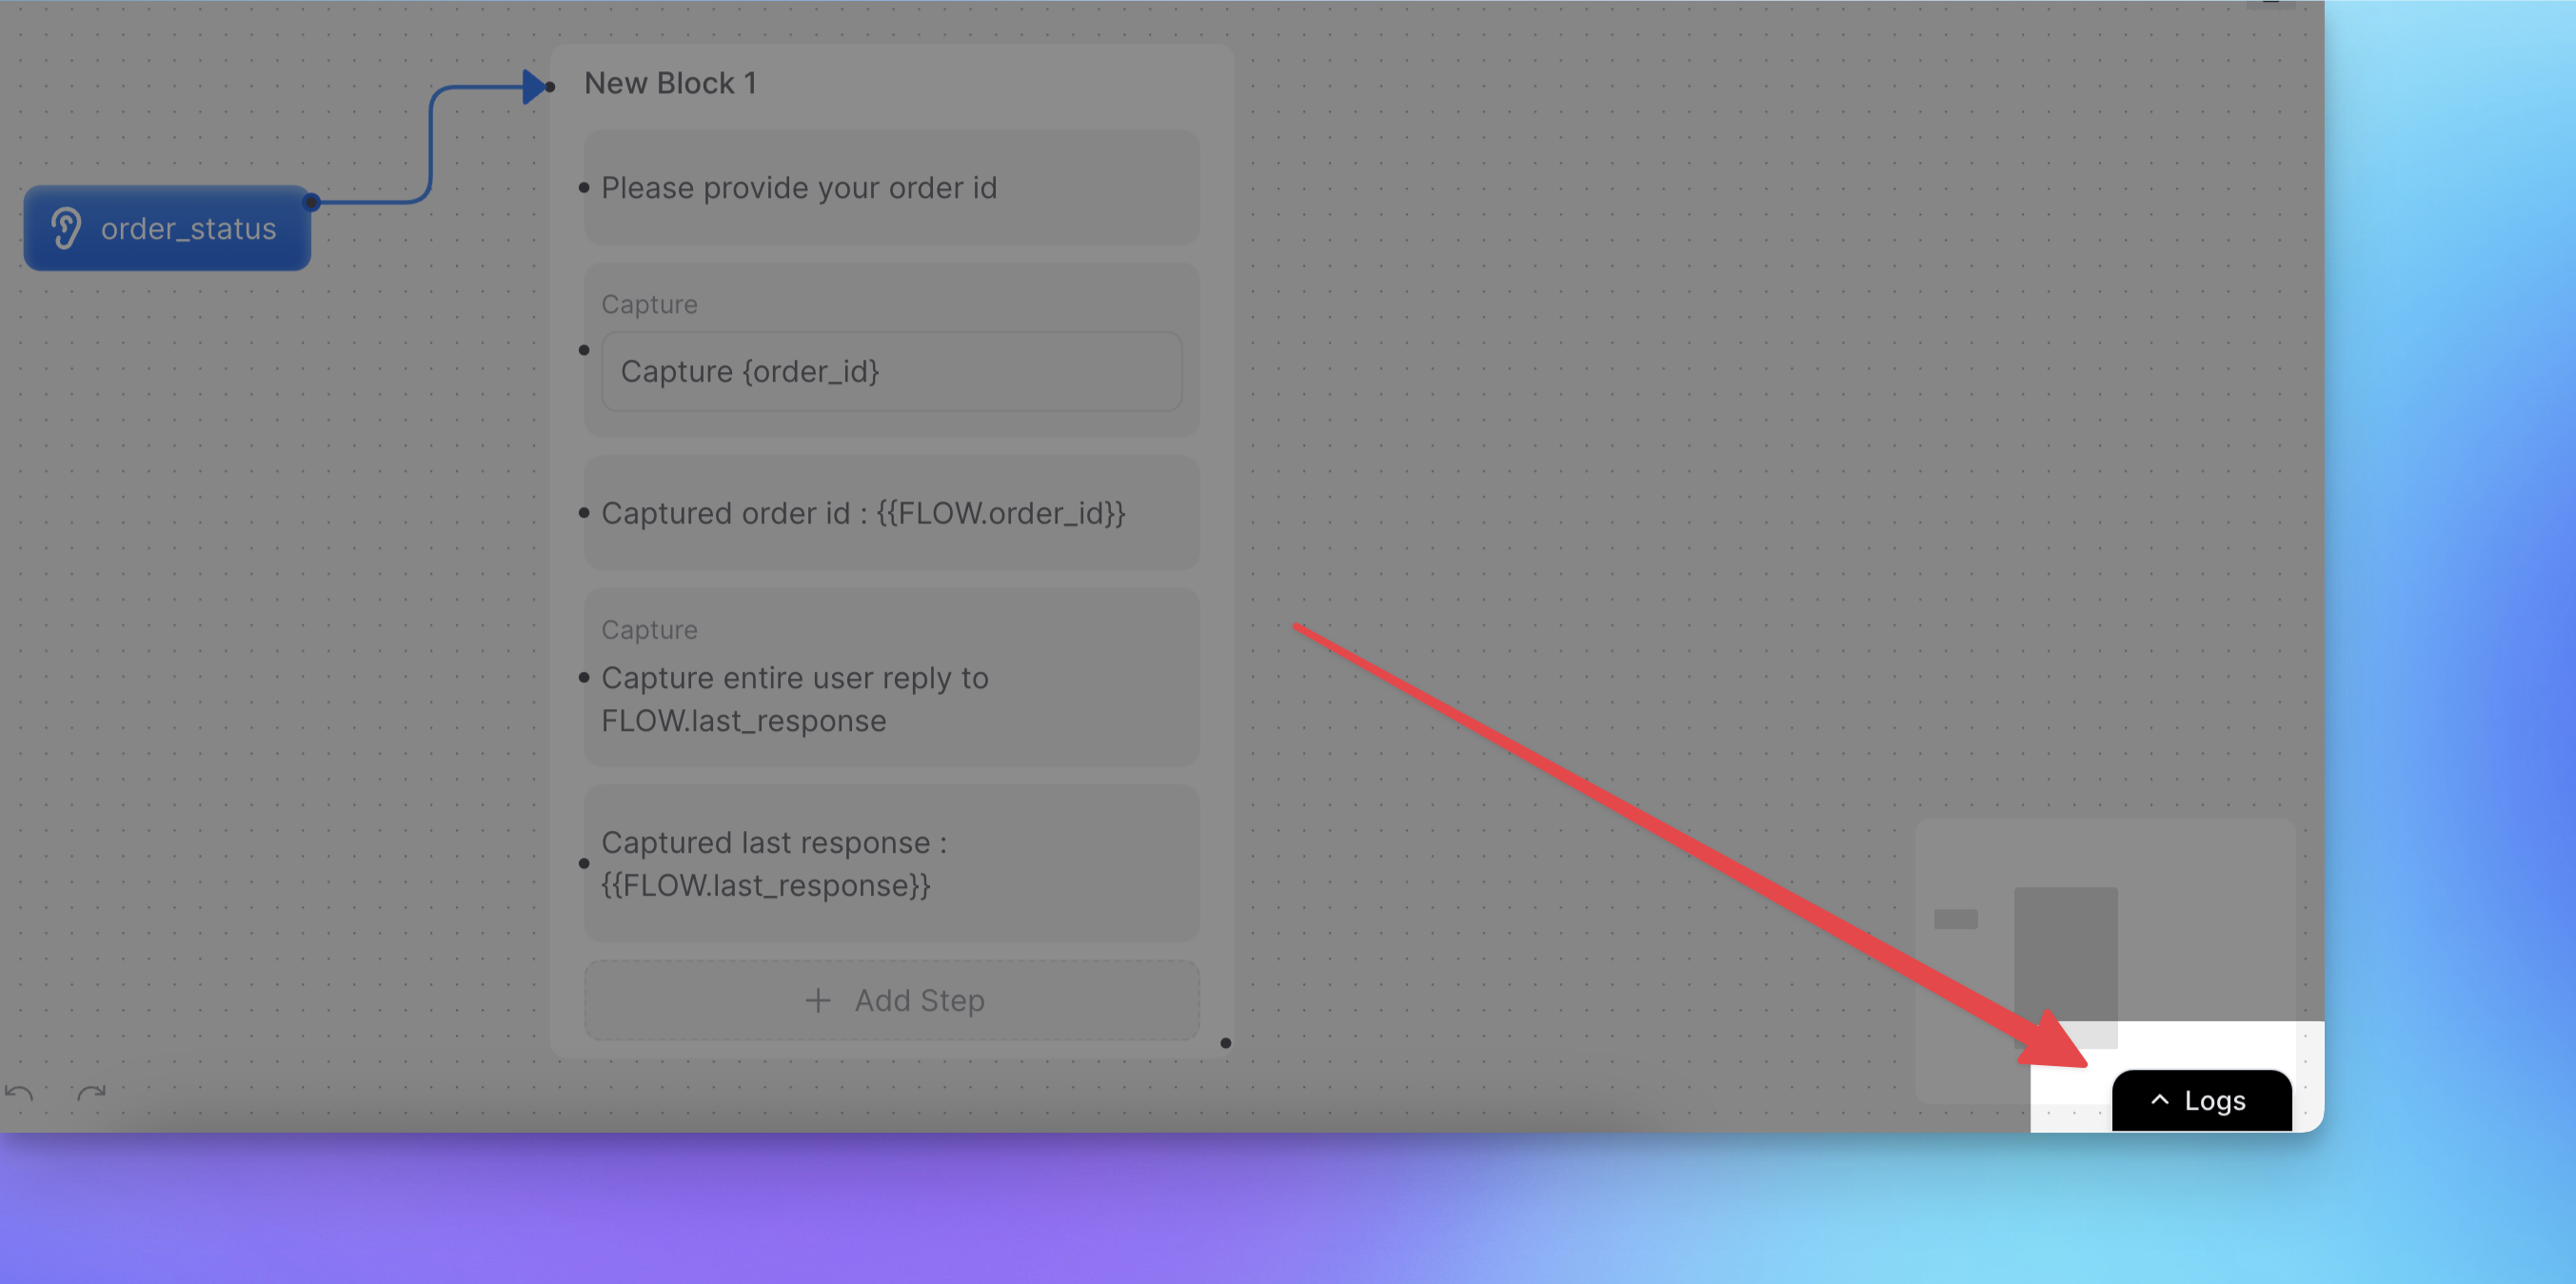
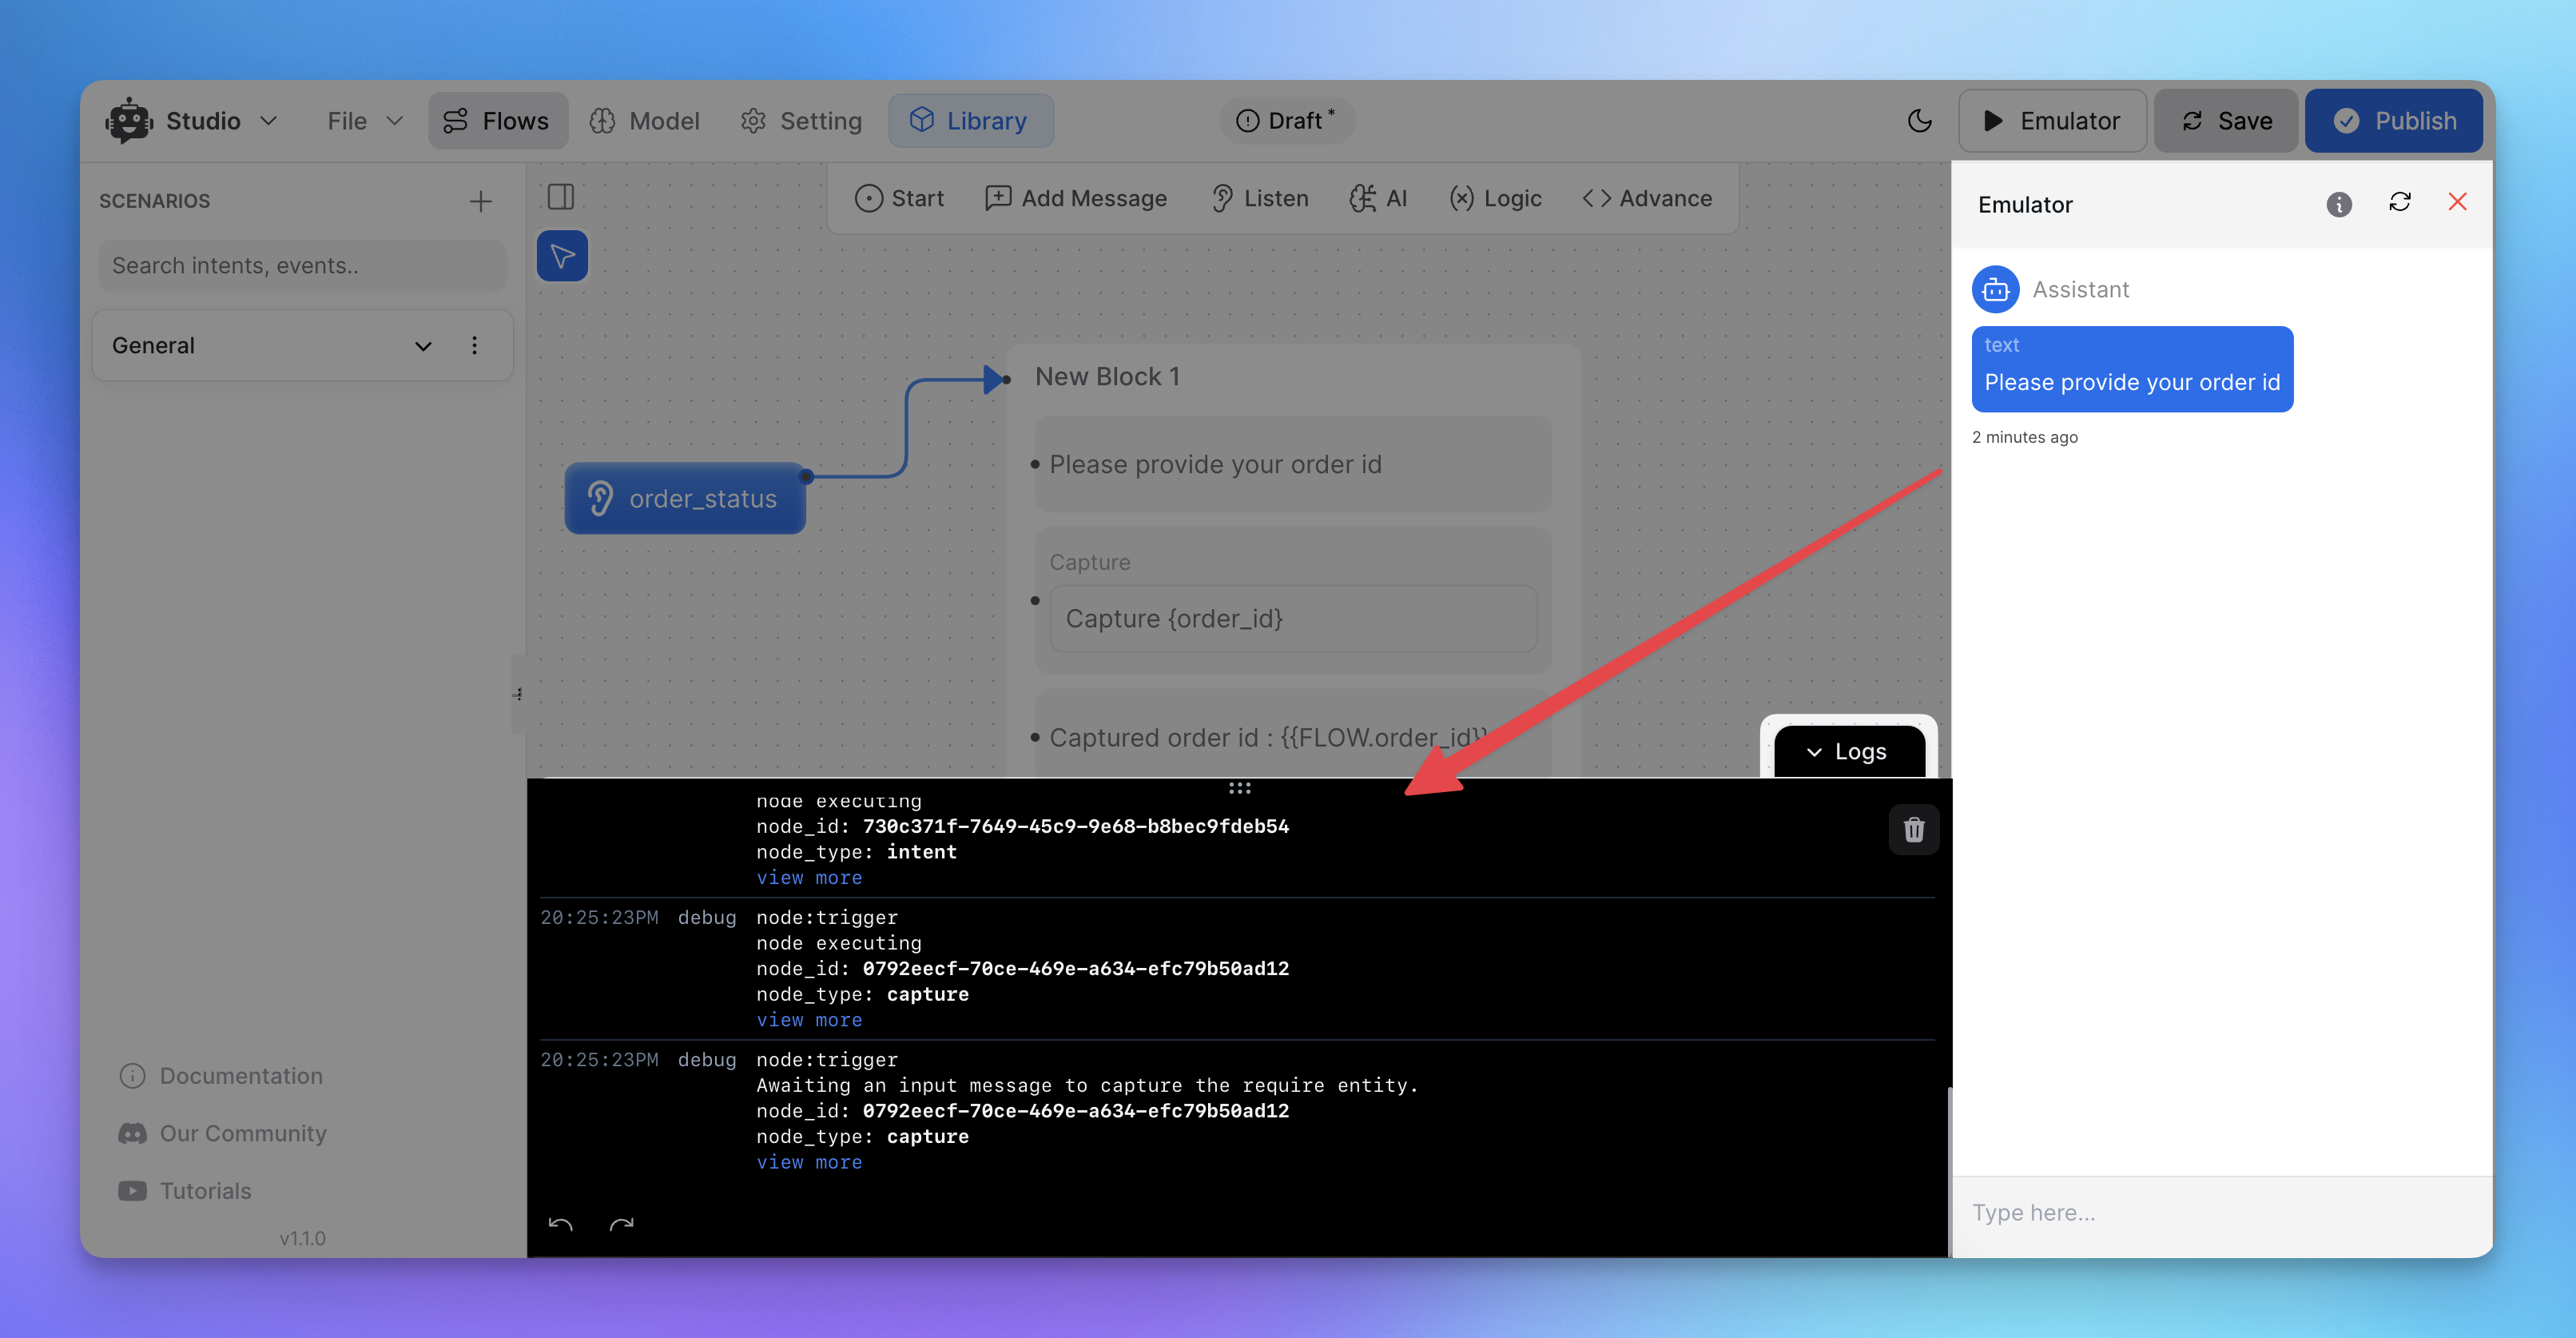
For each scenario or flow you build in Chatbot Studio, it’s important to test and debug it to ensure smooth operation. You can view execution logs in the the log window which you can open by clicking the Logs button at the bottom right of the studio interface. Here all the execution logs will be printed in real time whenever we test anything in the emulator.

What You’ll See in the Logs:

The logs give a real-time view of your flow’s execution, showing:
Intents and Events detected during conversations.
Node Execution, tracking which blocks or steps are triggered.
Variable Changes as data is updated throughout the flow.
API Calls and Responses, if your flow interacts with external services.
Errors or Warnings to help troubleshoot issues.
This allows you to quickly assess how your flow is performing and identify any potential issues.
Understanding Node and Scenario IDs
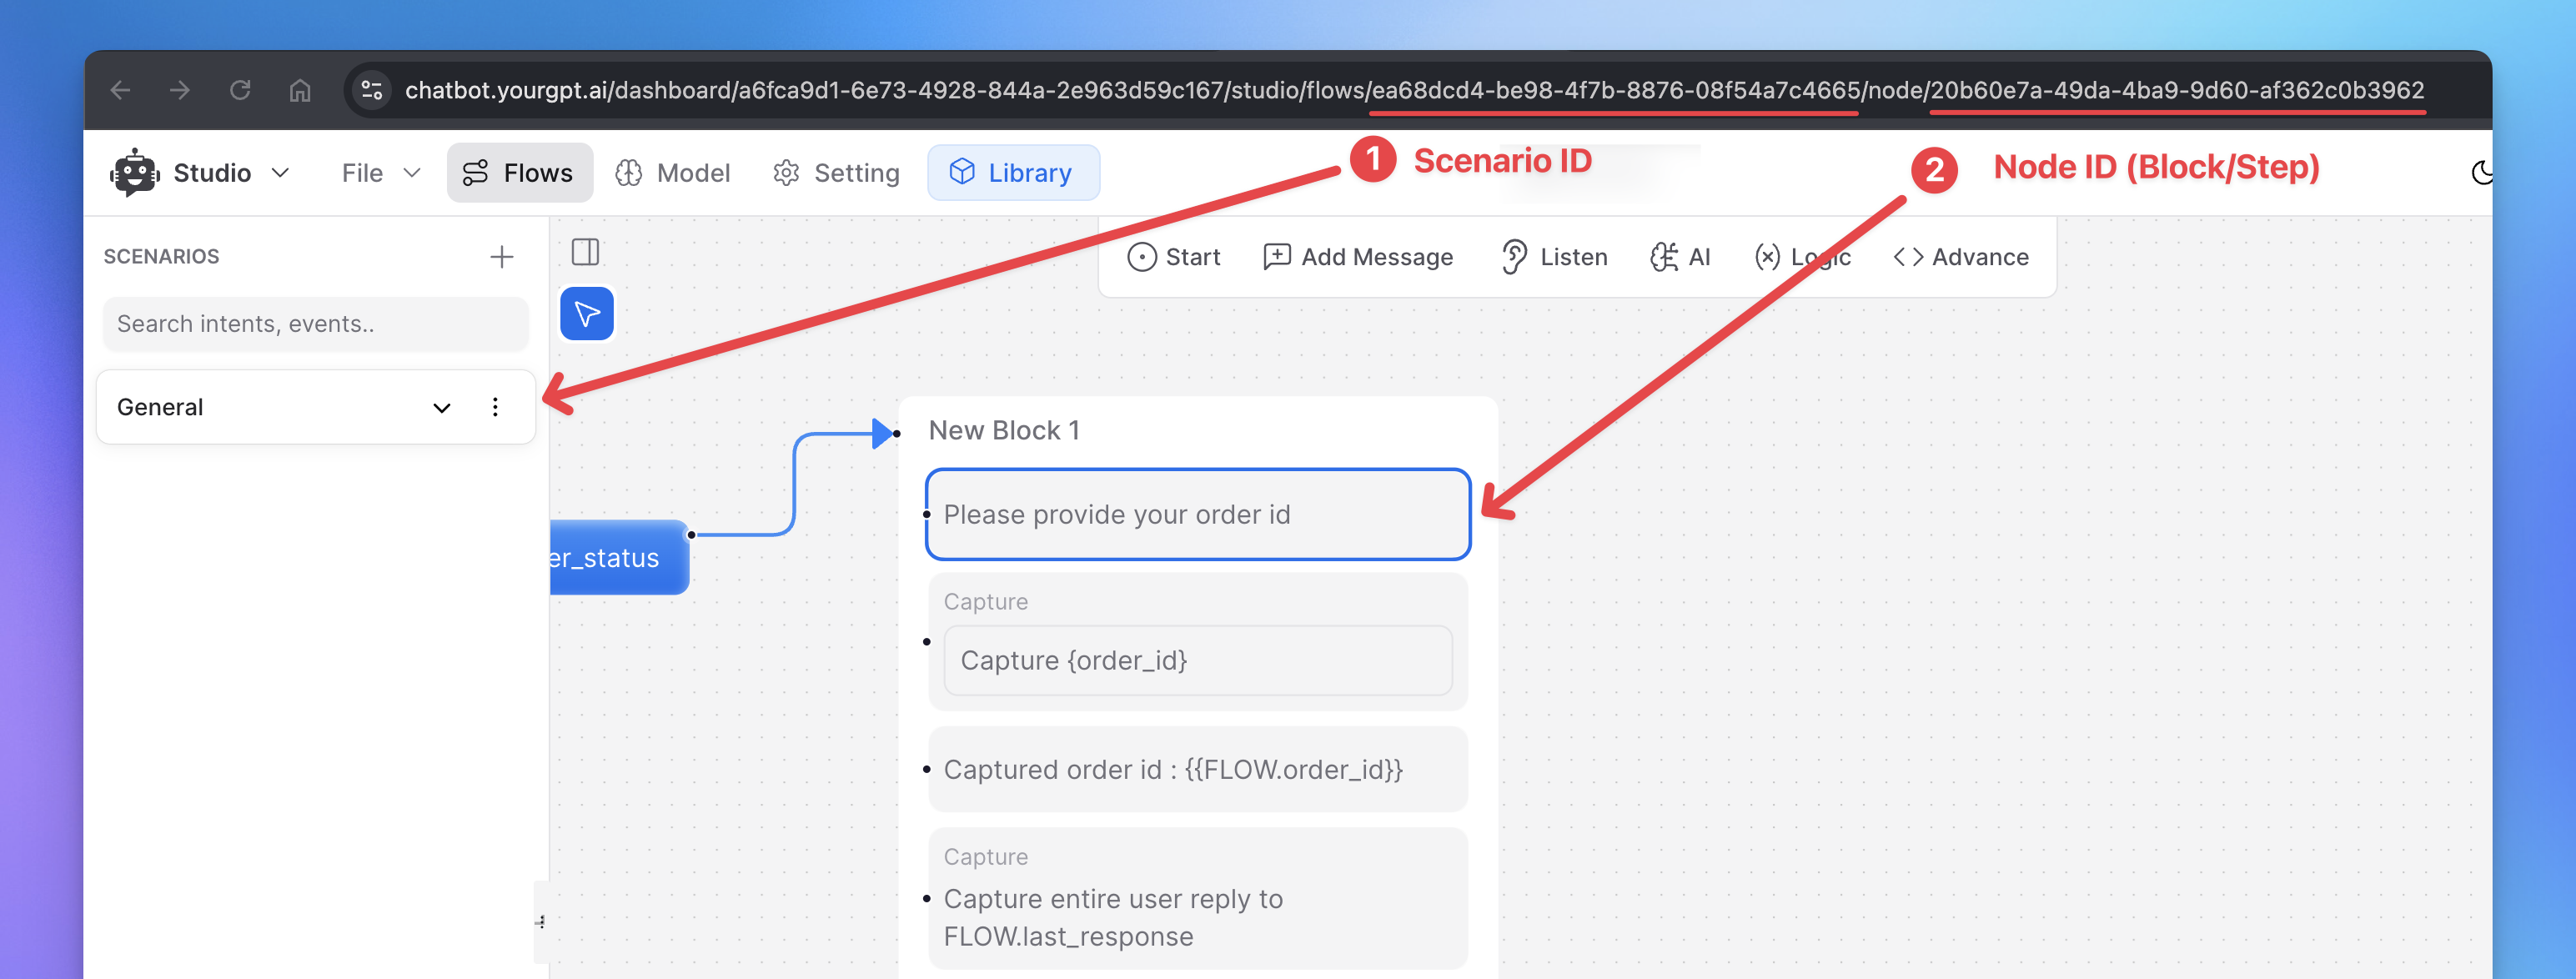
Each node (whether it’s a block, step, or any other element) has a unique ID. This ID helps identify specific parts of your flow when reviewing logs. Here’s how you can reference it:
When you select a scenario, block, or step node on the canvas, the URL in the browser will automatically reflect the unique ID of that selection.
By cross-referencing these IDs with the logs, you can pinpoint exactly which node or block triggered at any point in the conversation.

Tip: Always note the IDs in logs to troubleshoot and ensure that the correct parts of your flow are being executed.
Viewing Emulator Session Details

The Session Details in the emulator provide additional insights into the current chatbot session. Here’s how to access and use this information:
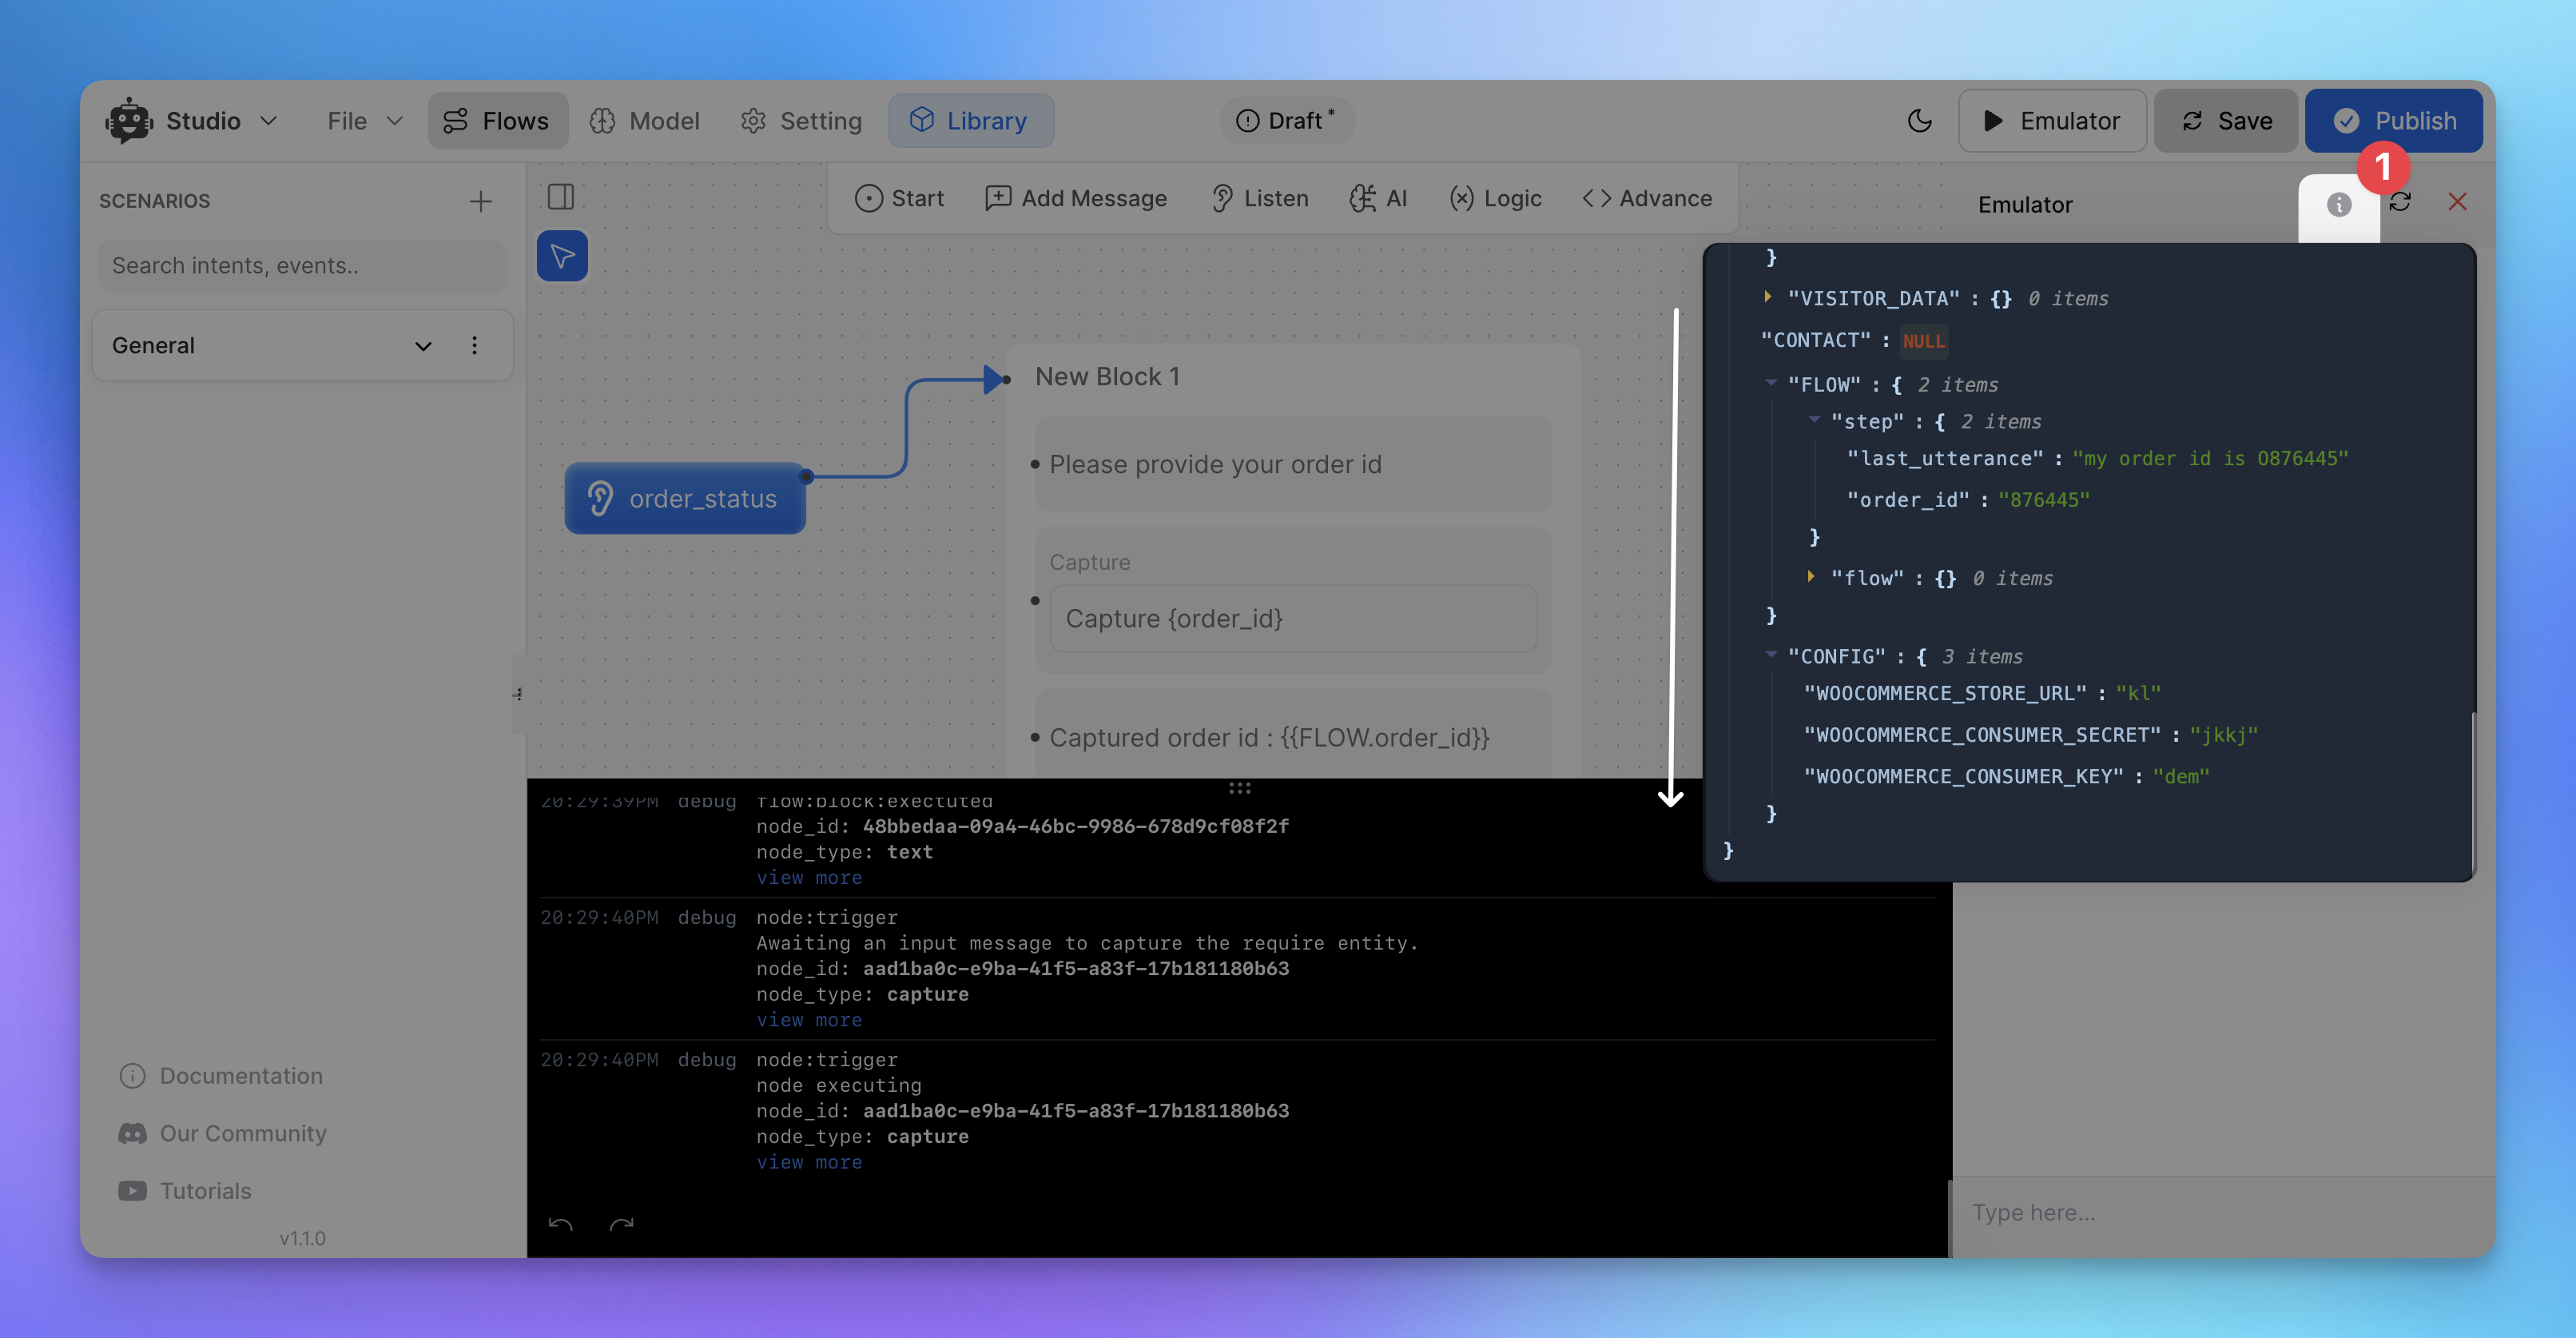
Click the Info Button: At the top of the emulator screen, click the Info (i) button to open the Session Details.
Review Session Details: This window will display important information about the ongoing chat session, including metadata and session-specific variables.
FLOW Object: Scroll to the bottom of the session details to find the FLOW object. This object contains all the variables and their current stored values, helping you track what data is being held in the session.
Note: The session details are not updated in real-time. To refresh the values in the FLOW object, close the popup and open it again.
Avoiding Common Mistakes with the FLOW Object:
When working with variables, it’s important to remember that the structure of the FLOW object seen in the session details may not match how variables are accessed within the studio itself. For example, the FLOW object in the logs is formatted differently than the studio’s syntax for accessing variables.
Incorrect: {{FLOW.step...}}
Correct: Ensure you reference variables using the correct syntax which you can check here in the Variable docs
Conclusion: Effective Debugging with Logs
By using the emulator logs and session details, you can effectively monitor and debug your chatbot flows. Tracking which nodes trigger, understanding how variables change, and referencing node IDs in the logs will give you a clear picture of how your chatbot performs during live interactions.
Related Articles
How to use Intents in Chatbot Studio?
This guide walks you through creating and using Intents to enhance your chatbot’s capabilities.
Flow : Scenarios, Blocks, Steps & Connections
This article fully details how steps/nodes and blocks work, how to configure them, create paths and connections.
How to capture and store a user’s response?
This article provides a complete guide on capturing user responses, such as name, email, and more, and shows how to store and utilize them in your chatbot to create personalized and engaging experiences.
How to Add & Configure Text, Image, and File Messages in Studio
Learn how to send text, images, and files with your ai agent using studio.
How to Set Up Conditions in AI Studio
Set Conditions to Understand What Information Users Are Looking For
How to create and use forms in AI Studio?
This guide will walk you through the process of creating and using forms to improve the user experience with your AI agent
